Expression
Illustration
Technical line illustration, drawn like a datasheet. Flat token color, engineering annotation, one accent per figure. Use this treatment for Altris technical illustration.
homepage illustrations
Built from the chemistry up
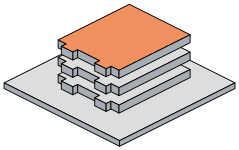
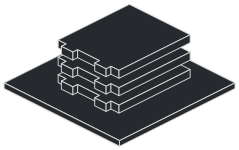
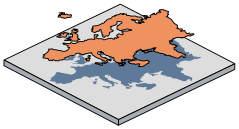
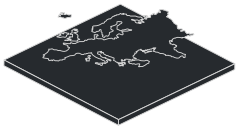
Three ideas, each with a fill and line treatment. Keep the perspective, proportions and detail consistent across the set.
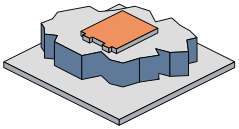
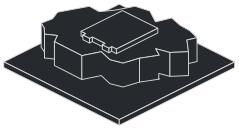
01 · Principles
Drawn like a datasheet
Illustration exists to explain — chemistry, validation, supply chains. It borrows its authority from engineering drawing, not from tech-brand decoration.
01
Flat, line-led
Uniform stroke, flat fills from the token palette. No 3D gloss, no soft shadows, no sci-fi glow.
02
Token color only
Graphite draws, Baltic supports, High Voltage marks the one thing that matters. Same ordering as data viz.
03
Annotated
Figures carry labels, units, and callouts in Axia Regular — like the drawing came off a spec sheet.
04
Accessible
Every informative SVG ships with a <title> and <desc>. Decorative art is marked aria-hidden.
02 · Style 01 — technical line
Technical figures
Technical illustrations for chemistry and performance. Dark schematic stages for chemistry; light validation traces for performance evidence.
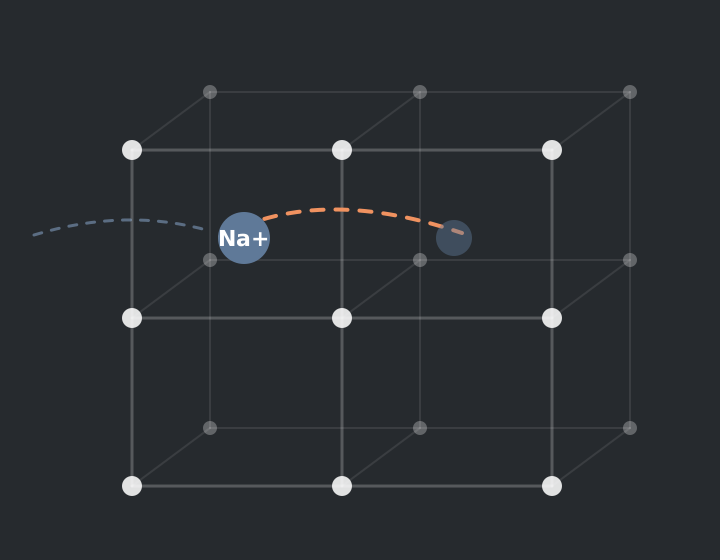
chemistry-framework.svg · dark stage720 × 560
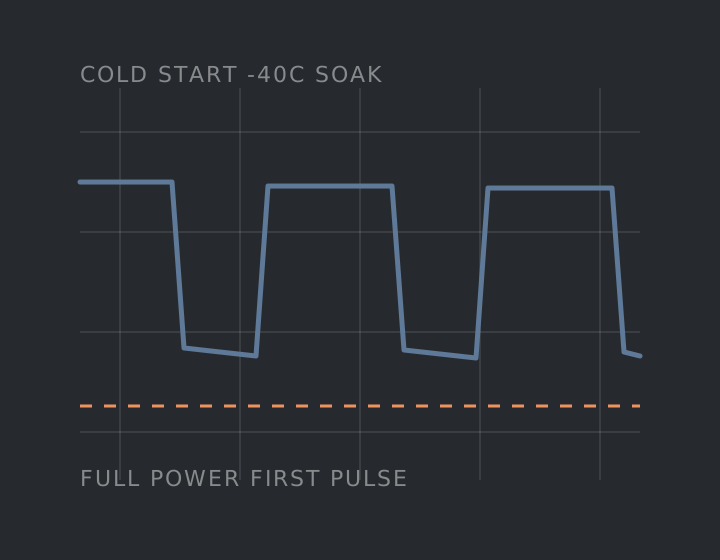
validation-cold.svg−40 °C
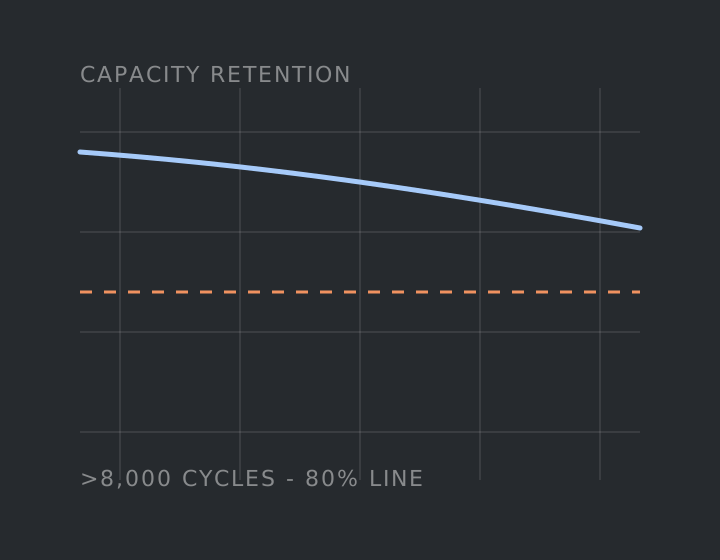
validation-cycle.svgcycle life
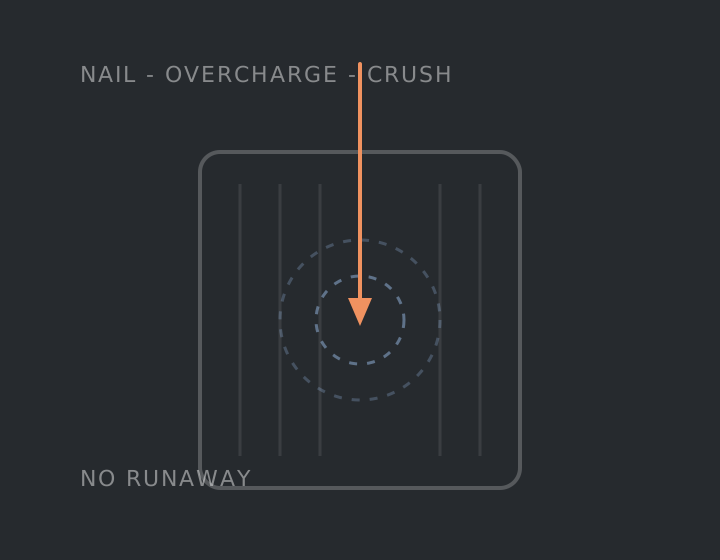
validation-safety.svgabuse tests
03 · Maps
The pixel world
Geography renders as a coarse pixel raster — supply chains and European sovereignty told in squares, not strokes. Decorative only, always behind content.

world-pixel-background.svg · altris.sedecorative
Rules. Single token tint (Baltic or Steel steps) at low opacity on light grounds, or Steel on Graphite. Never carries data — if a map must communicate quantity, it becomes a data-viz chart with a legend. Marked
aria-hidden; no alt text needed.
04 · Editorial figures
Performance, climate and European supply
Use these figures to explain performance, climate resilience and European supply. Their colors follow the Altris palette.
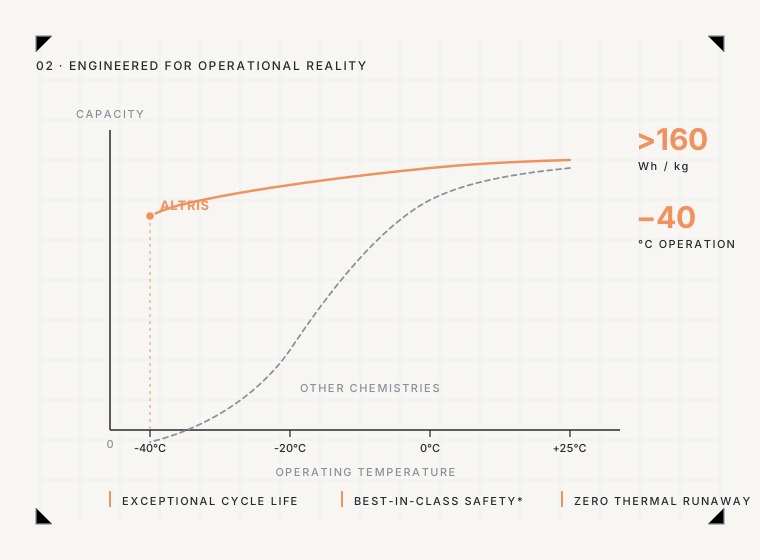
pp2_performance.svgAltris palette
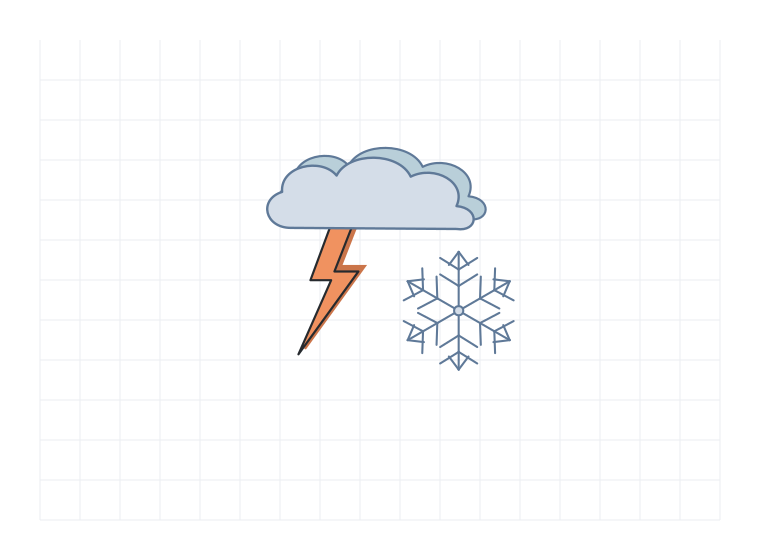
pp2_weather.svgAltris palette
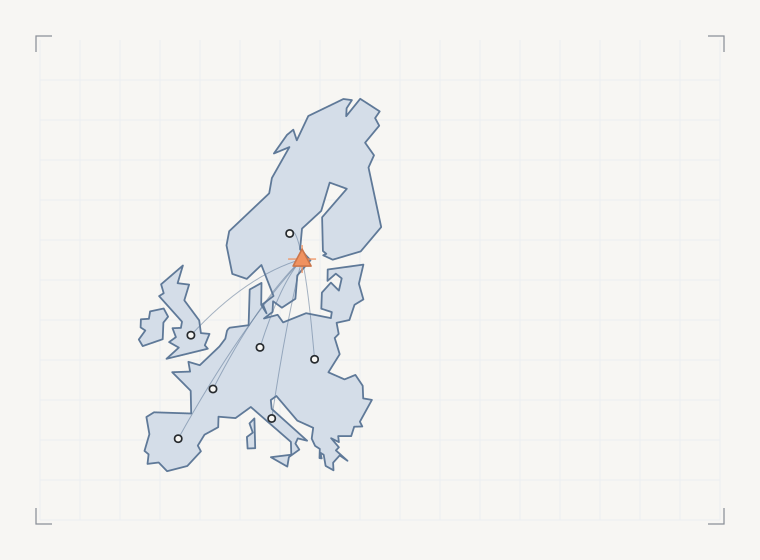
pp3_europe.svgAltris palette
05 · Don't
Off-system illustration
Same test as color: if the figure needs one of these, the figure is wrong.
×
Sci-fi tropes
No glows, particle fields, circuit-board wallpaper, or speculative moodscapes. We build for factories and fleets today.
×
Stock isometric people
No generic illustrated humans pushing oversized objects. People appear in photography, where they are real.
×
Gradient depth
Depth comes from line weight and overlap, not gradient shading. Flat fills only.
×
Unlabeled diagrams
A figure without units or annotation is decoration. If there is nothing to label, question the figure.
supply chain icons
Verified, traceable and sovereign
The six supply-chain stage icons. Use them to explain the process; keep them distinct from product drawings and the Altris wordmark.


